How much does an international wire transfer really cost? The full fee breakdown for 2026
International wire transfer fees explained: the wire charge, FX markup, intermediary deductions and receiving-bank fees, and what each channel costs in 2026.
- The advertised wire fee is the smallest of four charges. A typical US bank international wire costs US$35–50 to send, but the exchange-rate markup, intermediary deductions and receiving-bank charges usually add several times that.
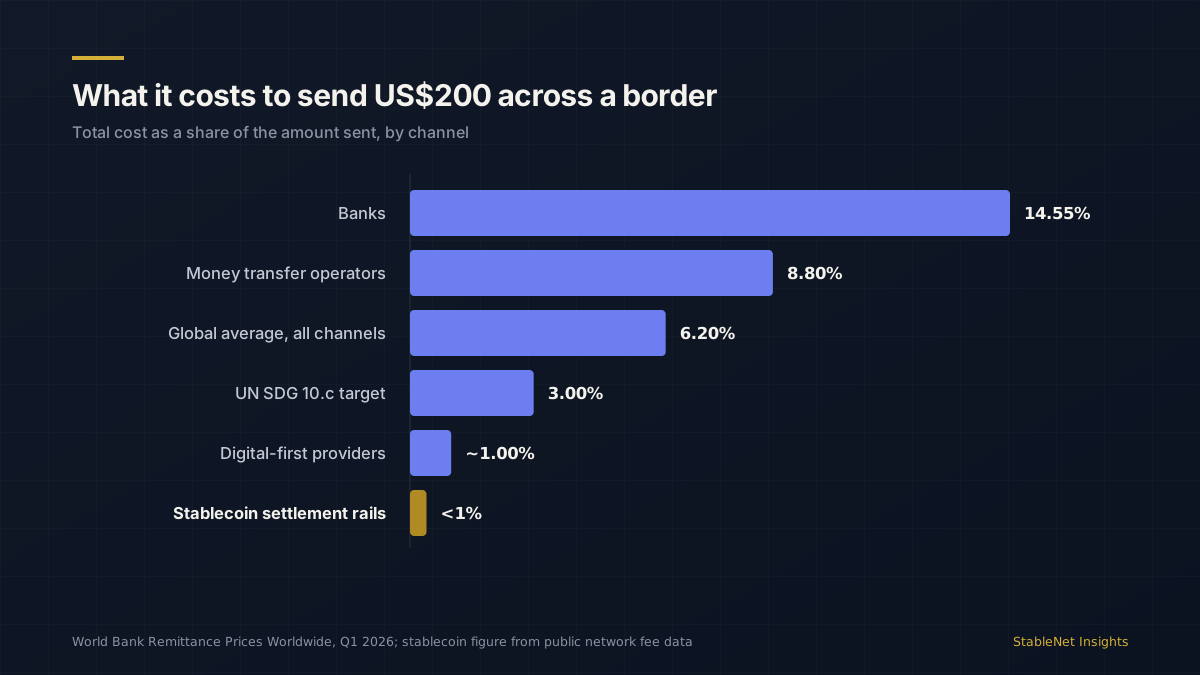
- On the World Bank’s benchmark of sending US$200, banks average roughly 14.55% of the amount sent, money transfer operators roughly 8.8%, and the global average across all channels is roughly 6.2% as of Q1 2026.
- That global average remains more than double the UN Sustainable Development Goal target of 3%, a target set for 2030 and not on track.
- The largest hidden component is the FX spread, because it is priced into the rate rather than shown as a fee — which is why two providers quoting the same fee can differ by tens of dollars on the amount actually delivered.
- Stablecoin settlement rails change the cost structure rather than trimming the fee: value moves without a correspondent chain, so intermediary deductions and pre-funded liquidity largely leave the equation.
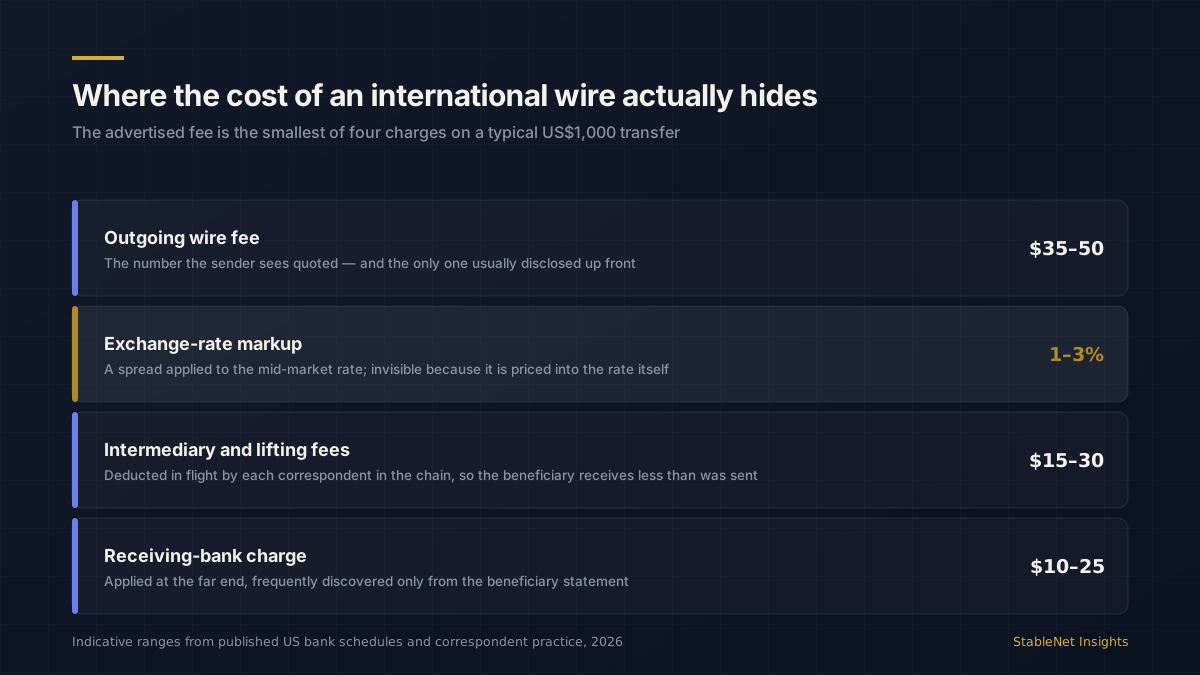
A US bank will typically quote US$35 to US$50 to send an international wire. That number is close to meaningless as a measure of what the transfer costs. Add the exchange-rate markup applied to the conversion, the lifting fees deducted in flight by each correspondent bank, and the charge levied by the beneficiary’s bank at the far end, and the real all-in cost of a US$1,000 transfer commonly lands between US$70 and US$115 — seven to eleven and a half per cent. On the World Bank’s benchmark US$200 transfer, banks average roughly 14.55% as of the first quarter of 2026. This is the anatomy of that number.
What are the four costs in an international wire?
The first is the outgoing wire fee, set by the sending bank, and the only one usually disclosed clearly up front. The second is the exchange-rate markup: the difference between the mid-market rate and the rate the bank applies, typically one to three per cent for a retail or small-business customer at a major bank. Because it is expressed as a rate rather than a fee, it does not appear on the confirmation as a charge at all — which is precisely why it is the largest component in most transfers.
The third is intermediary and lifting fees. A cross-border wire is rarely a direct hop; it routes through one or more correspondent banks, each of which may deduct its own charge from the principal in transit. The sender is not billed for these; the beneficiary simply receives less than was sent. The fourth is the receiving bank’s own inbound charge, frequently discovered only when the beneficiary looks at their statement and asks why the amount is short.
What does each channel actually cost?
The World Bank’s Remittance Prices Worldwide database is the closest thing to a neutral benchmark, because it measures total cost — fee plus FX margin — as a share of a standard US$200 transfer. As of the first quarter of 2026 the global average across all channels is roughly 6.2%. Banks are the most expensive channel at roughly 14.55%. Money transfer operators average roughly 8.8%. Digital-first providers on high-volume corridors can bring the figure under 1%. Stablecoin settlement rails also sit under 1%, and on many networks the network fee itself is a fraction of a dollar irrespective of amount.
Two caveats keep this honest. The World Bank benchmark measures small consumer remittances, so the percentages are not a straight read-across to a US$500,000 corporate payment, where the fixed fee shrinks as a share and the FX spread dominates. And the sub-1% stablecoin figure covers the transfer itself; the fiat on-ramp and off-ramp at either end carry their own costs, which is exactly where a serious cost comparison should focus.
Why is the exchange rate the expensive part?
Because it is the only charge that scales with the size of the transfer while remaining invisible. A US$40 wire fee on a US$500,000 payment is a rounding error; a 1.5% spread on the same payment is US$7,500. The spread is also the hardest number to compare between providers, since a quote is normally given as a single all-in rate rather than as mid-market plus a disclosed margin. Two banks quoting identical fees can deliver amounts that differ by several per cent, and the customer has no line item to point at.
The practical defence is simple and rarely applied: benchmark every quote against the mid-market rate at the moment of quoting, and compare providers on the amount the beneficiary receives, not on the fee. For businesses running recurring corridors, tracking realised spread as a basis-point cost per corridor turns an invisible charge into a managed one.
Compare providers on the amount the beneficiary actually receives. Every other number in the quote is negotiable presentation.
What does the delay cost on top of the fee?
Cost analysis usually stops at fees, which understates the total materially for any business sending at volume. A wire that takes one to five business days ties up working capital for the duration; where the corridor requires pre-funded accounts in the destination market, capital is immobilised permanently rather than temporarily. Uncertainty about arrival generates its own cost in reconciliation effort, customer service contacts and payment tracing requests — and in cross-border operations, exception handling rather than the happy path is where the operating budget goes.
There is a commercial cost as well. A supplier that receives an uncertain amount on an uncertain date prices that uncertainty into its terms. Businesses that move to same-day, exact-amount settlement frequently recover more from improved supplier terms and reduced treasury buffers than from the fee saving that prompted the change.
What is changing in 2026?
Three trends are visible. Pricing is becoming more transparent under regulatory and competitive pressure, with more providers quoting against the mid-market rate — though disclosure of a spread is not the same as eliminating it. Domestic instant-payment systems have raised customer expectations sharply: a consumer whose domestic transfers settle in seconds does not accept a four-day international transfer as a technical necessity. And stablecoin settlement has moved from experiment to infrastructure, with payout networks connecting stablecoin wallets alongside bank accounts and mobile money, and remittance incumbents adding on-chain corridors rather than defending against them.
What has not changed is the global average. At roughly 6.2%, the cost of sending money across a border remains more than double the 3% target set under Sustainable Development Goal 10.c, and that target is not on track. The gap between the cheapest available channel and the average actually paid is the most striking fact in the data: the technology to send money for under 1% exists and is in production, while the average sender still pays six times that.
How do stablecoin rails change the arithmetic?
Not by discounting a fee, but by removing a layer. On a correspondent wire, cost accumulates because value passes through a chain of intermediaries, each with its own charge, cut-off times and liquidity requirements. On a stablecoin rail, value moves directly from sender to receiver on a shared ledger, reaching finality in seconds. The intermediary deductions disappear because there are no intermediaries; the network fee is small and largely independent of amount; and because settlement is on demand, the pre-funded balances that corridors otherwise demand shrink substantially.
The costs that remain are the ones worth interrogating in any vendor conversation: the spread on converting fiat to a stablecoin at the sending end, the spread on converting back to local currency at the receiving end, and the compliance overhead of screening and Travel Rule data on both sides. A provider that quotes a low network fee while staying vague about the on-ramp and off-ramp spread is quoting the least interesting number in the transaction.
How should a business benchmark its own cost?
- Measure landed amount, not fee. For each corridor, record the amount instructed, the amount the beneficiary confirmed receiving, and the mid-market rate at the moment of quoting. The difference is your true all-in cost, and it is the only figure comparable across providers.
- Express it in basis points per corridor. A percentage of a US$200 consumer remittance and a percentage of a US$500,000 supplier payment are not the same measurement; basis points per corridor per month is what a treasury team can actually manage.
- Separate the four components. Wire fee, FX spread, in-flight deductions and inbound charge behave differently as volume and ticket size change, so a blended number hides which lever to pull.
- Price the float. Count the working capital sitting in transit and the balances pre-funded in destination corridors at your own cost of funds. On high-volume corridors this routinely exceeds the fees.
- Count the exception rate. Repairs, returns, missing beneficiary data and tracing requests carry a real per-item operational cost. Track how many payments per hundred need human intervention.
- Re-benchmark quarterly. Corridor pricing, spreads and available rails all move, and the cheapest channel eighteen months ago is rarely the cheapest today.
Businesses that run this exercise are usually surprised twice: first by how much of the cost was in the spread rather than the fee, and second by how much of it was in float and exception handling rather than in either. Those two findings tend to change which provider question matters most — from “what do you charge” to “what does the beneficiary receive, when, and how often does something go wrong”.
Where StableNet fits
StableNet is the settlement layer that removes the intermediary chain without asking an institution to abandon the messaging it already runs. Payments enter over SWIFT MT and ISO 20022 and settle as compliant stablecoin transfers reaching finality in seconds, with KYC, KYB, KYT, sanctions screening and Travel Rule data attached to the payment itself. For a bank or MSB, the effect on cost is structural rather than promotional: fewer hops taking a cut, less capital immobilised in destination corridors, and an exact amount arriving on a known timetable — including at the weekend.
See it on your corridors
Book a working session and we’ll map StableNet’s compliance and settlement to one of your live payment flows.